By Jeremy Allen
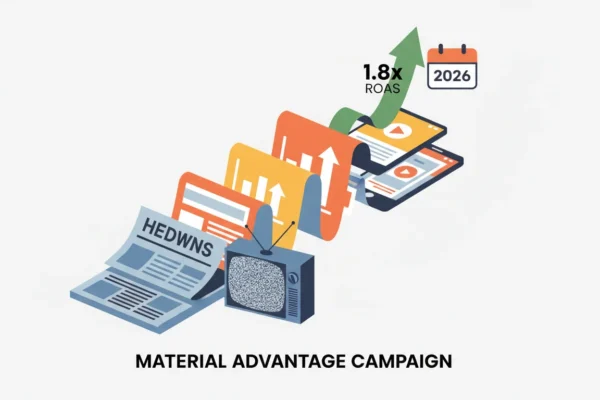
Data-driven marketing works. When it’s done right, businesses report performance gains as high as 3.5x. So how do you get your own marketing efforts to produce those kinds of measurable improvements?
Key Takeaways
- Build a central data strategy with platforms like Google Analytics 4 and a CRM to get a single view of your customer.
- Before you launch anything, develop clear, measurable Key Performance Indicators (KPIs) that tie directly to your business goals.
- Use A/B and multivariate testing all the time, making small changes based on real results, not what you *think* will work.
- Bring in Business Intelligence (BI) tools like Tableau or Microsoft Power BI to visualize your data and spot trends you’d otherwise miss.
- Audit your data sources for accuracy constantly. Bad data leads to bad decisions that can completely derail your marketing.
1. Establish a Strong Data Collection Framework
You can’t have a data-driven strategy without good data. It all starts with collecting it completely and accurately. If you’re working with unreliable inputs, your analysis is just guesswork. We’re talking about tracking every customer interaction, not just website traffic. The goal is to build one single, unified picture of the entire customer journey. First, get your website analytics configured correctly. For example, Google Analytics 4 (GA4) uses an event-based model that’s powerful for tracking user behavior across your site and apps, giving you a much fuller picture of engagement. You need to set up custom events for the actions that actually matter to your business, like form submissions, video plays, or specific PDF downloads. Then, connect your Customer Relationship Management (CRM) system, whether it’s Salesforce or HubSpot CRM, to your marketing platforms. This is how you connect the money you spend on ads to actual sales, finally attributing revenue to the right campaigns. Your email tools, like Mailchimp or Braze, must also feed their engagement data back into your main repository. This integration across platforms is essential. Pro Tip: Don’t forget about offline data. If you have physical stores, figure out how to anonymize and integrate your point-of-sale (POS) data, loyalty program info, or even in-store Wi-Fi logins. The more touchpoints you can connect, the clearer your understanding of customer behavior gets. It’s about connecting all these different data points into a story that makes sense. Common Mistake: Implementing tons of tracking pixels without any real strategy. This just leads to redundant data, potential privacy headaches, and a slower website. Figure out what data you actually need, and make sure every script has a specific job. A messy Google Tag Manager container can become a huge liability fast.
2. Define Clear, Measurable KPIs and Objectives
With your data flowing, you have to define what you’re actually trying to achieve. You need to establish Key Performance Indicators (KPIs) that align directly with your business goals. Vague targets like “increase brand awareness” won’t cut it. You need to get specific: “Increase organic search visibility for core product keywords by 20% in the next six months,” or “Reduce customer acquisition cost (CAC) for paid social campaigns by 15% quarter-over-quarter.” These goals are concrete and can be measured against a timeline. For instance, if you’re trying to boost online sales, your main KPIs would be conversion rate, average order value (AOV), and customer lifetime value (CLTV). If you’re focused on lead generation, you’d track lead volume, cost per lead (CPL), and your lead-to-opportunity conversion rate. The IAB Digital Ad Spend Report 2023 showed a major shift toward performance advertising, which shows why you have to link every dollar of ad spend to a real outcome. Your KPIs have to be SMART: Specific, Measurable, Achievable, Relevant, and Time-bound. You also need to review these KPIs regularly, because what mattered last year might not be the priority today after a market shift or a new product launch. This requires ongoing effort. Pro Tip: Build a KPI dashboard in a tool like Google Looker Studio or Tableau from day one. Seriously. This creates a single source of truth that stops arguments about whose numbers are right and keeps the conversation focused on performance. Make sure you include trend lines and comparisons (like month-over-month) to give the numbers context. Common Mistake: Chasing vanity metrics. These are numbers that feel good but have no real connection to business growth. For example, a high social media follower count is useless if none of those people ever engage or buy anything, just as raw page views mean nothing if everyone bounces immediately. Focus on the metrics that actually affect your profit.
3. Implement A/B Testing and Experimentation
You can’t be data-driven without constant experimentation. You can sit in a room and guess what your audience wants, or you can run tests to get actual answers. A/B testing is simple: you compare two versions of something (a webpage, an email, an ad) to see which one performs better. Multivariate testing just lets you test multiple changes at once. For example, you could A/B test two different headlines on a landing page to find the one with the higher conversion rate, or you could test a green call-to-action (CTA) button against a blue one. There are plenty of tools for this, like Optimizely or VWO, and GA4 has built-in features as well. When you set up a test, have a clear hypothesis, like “Changing the CTA button color from blue to green will increase click-through rate by 5%.” Then you have to let the test run long enough to get a statistically significant result, which means you need enough conversions to know the outcome wasn’t just random luck. Don’t just test your website. Test ad creative and audience segments in Google Ads or Meta Ads Manager. Test different email subject lines and send times. Every single test gives you valuable information, even the ones that fail. This cycle of testing, analyzing, and improving is what leads to those big performance gains. Pro Tip: Prioritize your tests. Don’t just test random things. Use your analytics to find the biggest opportunities or problems. If you see a really high bounce rate on a specific product page, that’s where you should start testing. A Nielsen report on consumer behavior confirmed that brands that adapt through this kind of continuous testing are the ones that succeed. Common Mistake: Calling a test too early or acting on bad data. A small lead for one version after just a few days is probably just noise, not a real result. Always wait for statistical significance, which is usually a 95% confidence level. Also, don’t run a bunch of tests on the same page at the same time, because their effects can interfere with each other and make your results meaningless.
4. Use Business Intelligence (BI) for Deeper Insights
Having the raw data from tests and analytics is one thing, but making sense of it all is where the real gains come from, and that’s what Business Intelligence (BI) tools are for. Platforms like Microsoft Power BI, Tableau, or Qlik Sense let you pull data from all your different sources (GA4, your CRM, ad platforms) into interactive dashboards. With a good BI setup, you can see correlations and trends that would be impossible to spot in a spreadsheet. For example, you could build a dashboard that shows exactly which blog posts are generating the most qualified leads over time, broken down by industry. Or you could analyze customer churn against product usage to spot at-risk accounts before they leave. Because these tools are visual, they get everyone from the marketing specialist to the CEO on the same page about what’s working and what isn’t. Imagine seeing instantly that customers who came from a certain Instagram campaign have a 20% higher lifetime value than customers from organic search. An insight like that immediately changes how you allocate your budget. That’s what BI tools give you. Pro Tip: Don’t try to build the perfect, all-encompassing dashboard on day one. You’ll just get analysis paralysis. Start with a few simple reports that answer your most important questions, then build from there as you get more comfortable with the data. Focus on making dashboards that tell a story, not just a grid of numbers. Common Mistake: Making dashboards too complicated. If you cram in too many metrics and charts, nobody will use it. A good dashboard should be easy to understand at a glance. If people need a 30-minute tutorial to figure it out, you’ve failed. Keep it simple and clear.
5. Continuously Refine and Adapt Your Strategy
This isn’t a project you finish. Data-driven marketing is a constant cycle of measuring, analyzing, and adapting. Markets change, customer behavior changes, and your strategy has to be ready to change with them. You should be reviewing your KPIs every month or quarter to track progress. When a campaign is underperforming, use your data to figure out why and make a change. For example, if your CPL for a specific ad campaign is way too high, dig into the data. Is the audience wrong? Is the creative bad? Is the landing page broken? Your data setup and BI tools should give you the answers. Based on what you find, you can adjust your bids, try new audience segments, or launch an A/B test on your landing page. This kind of refinement requires a team that’s always asking “why” when the numbers move. You want to build a simple feedback loop: data guides the strategy, strategy guides the execution, and that execution creates new data to start the loop over again. This is how businesses keep their momentum and accelerate their performance over time. Pro Tip: Schedule specific “data review” meetings. These aren’t the same as “campaign update” meetings. The only goal is to look at performance data, find insights, and decide on concrete next steps. Make sure the people who can actually approve those changes are in the room. Common Mistake: Treating data analysis like something you only do after a campaign is over. If you wait until the end to see what happened, you missed all the chances you had to fix things while it was running. Data review needs to be part of every single stage of a campaign, from planning all the way through the post-mortem. A real data-driven approach replaces guesswork with precision, and it lets you make decisions that have a direct impact on your bottom line. By consistently collecting, analyzing, and acting on your data, you can achieve huge, measurable wins.
What is data-driven marketing?
It’s using real customer data to make marketing decisions instead of just going with your gut. Every campaign, email, and ad is based on what the numbers tell you, moving your choices from intuition to actual evidence.
How can I start collecting relevant data for marketing?
Start by setting up a web analytics tool like Google Analytics 4. Then, integrate your CRM (like Salesforce or HubSpot) and make sure your email platform is tracking engagement. The goal is to connect these sources so you have a single view of the customer.
What are common pitfalls in data-driven marketing?
The big ones are collecting useless data, obsessing over vanity metrics that don’t affect revenue, calling A/B tests too early without enough data, and failing to connect all your different data sources into a coherent picture.
What is a good example of a marketing KPI?
A good KPI is specific and time-bound. For instance: “Increase organic search traffic to product pages by 15% in the next quarter” or “Reduce customer acquisition cost for paid social by 10% in the current fiscal year.”
How do Business Intelligence (BI) tools help marketing?
BI tools like Tableau or Power BI pull all your data into one place so you can visualize performance and spot trends. They help you find deeper insights and make it easier to explain complex data to your team, which helps with strategic decision-making. Thinking about how AI commerce helps brands adapt shows where these insights can lead.